Quickly Iterating on Developing and Debugging AWS Lambda Functions

Recently, I found myself having to develop a complex lambda function that required a lot of iteration and the need for interactive debugging. Iterating on lambda functions can be painful due to the amount of time it takes to re-deploy an update to lambda and trying to attach a debugger to lambda just isn't an option. If you find yourself re-deploying more than a handful of times, the delay introduced by the redeployment processes can feel like watching paint dry. I thought I'd take this opportunity to share some of my strategies to alleviate the issues I've encountered developing and debugging both simple and complex lambda functions.
I find that it is always useful to log the event or input (depending on your language of choice) for any deployed lambda function - while you can mock this out (and should for unit tests!), I've found that having the full event has been critical for some debug cases. Even with AWS X-Ray enabled on your function, there isn't enough information to usually recreate the full event structure. Depending on your codebase you may want to also log the context object, but in my experience, this is isn't usually necessary.
Method 1: A quick and dirty method
With the event logged, it is straightforward to build a quick harness to run the failure instance locally in a way that is usually good enough.
Let's look at an example in Python - if for example, our handler is handler() in my_lambda.py:
def handler(message):
    print('My Handler')
    print(message)
    # Do stuff

    # Error happens here
    raise Exception('Beep boop bop')

    return None
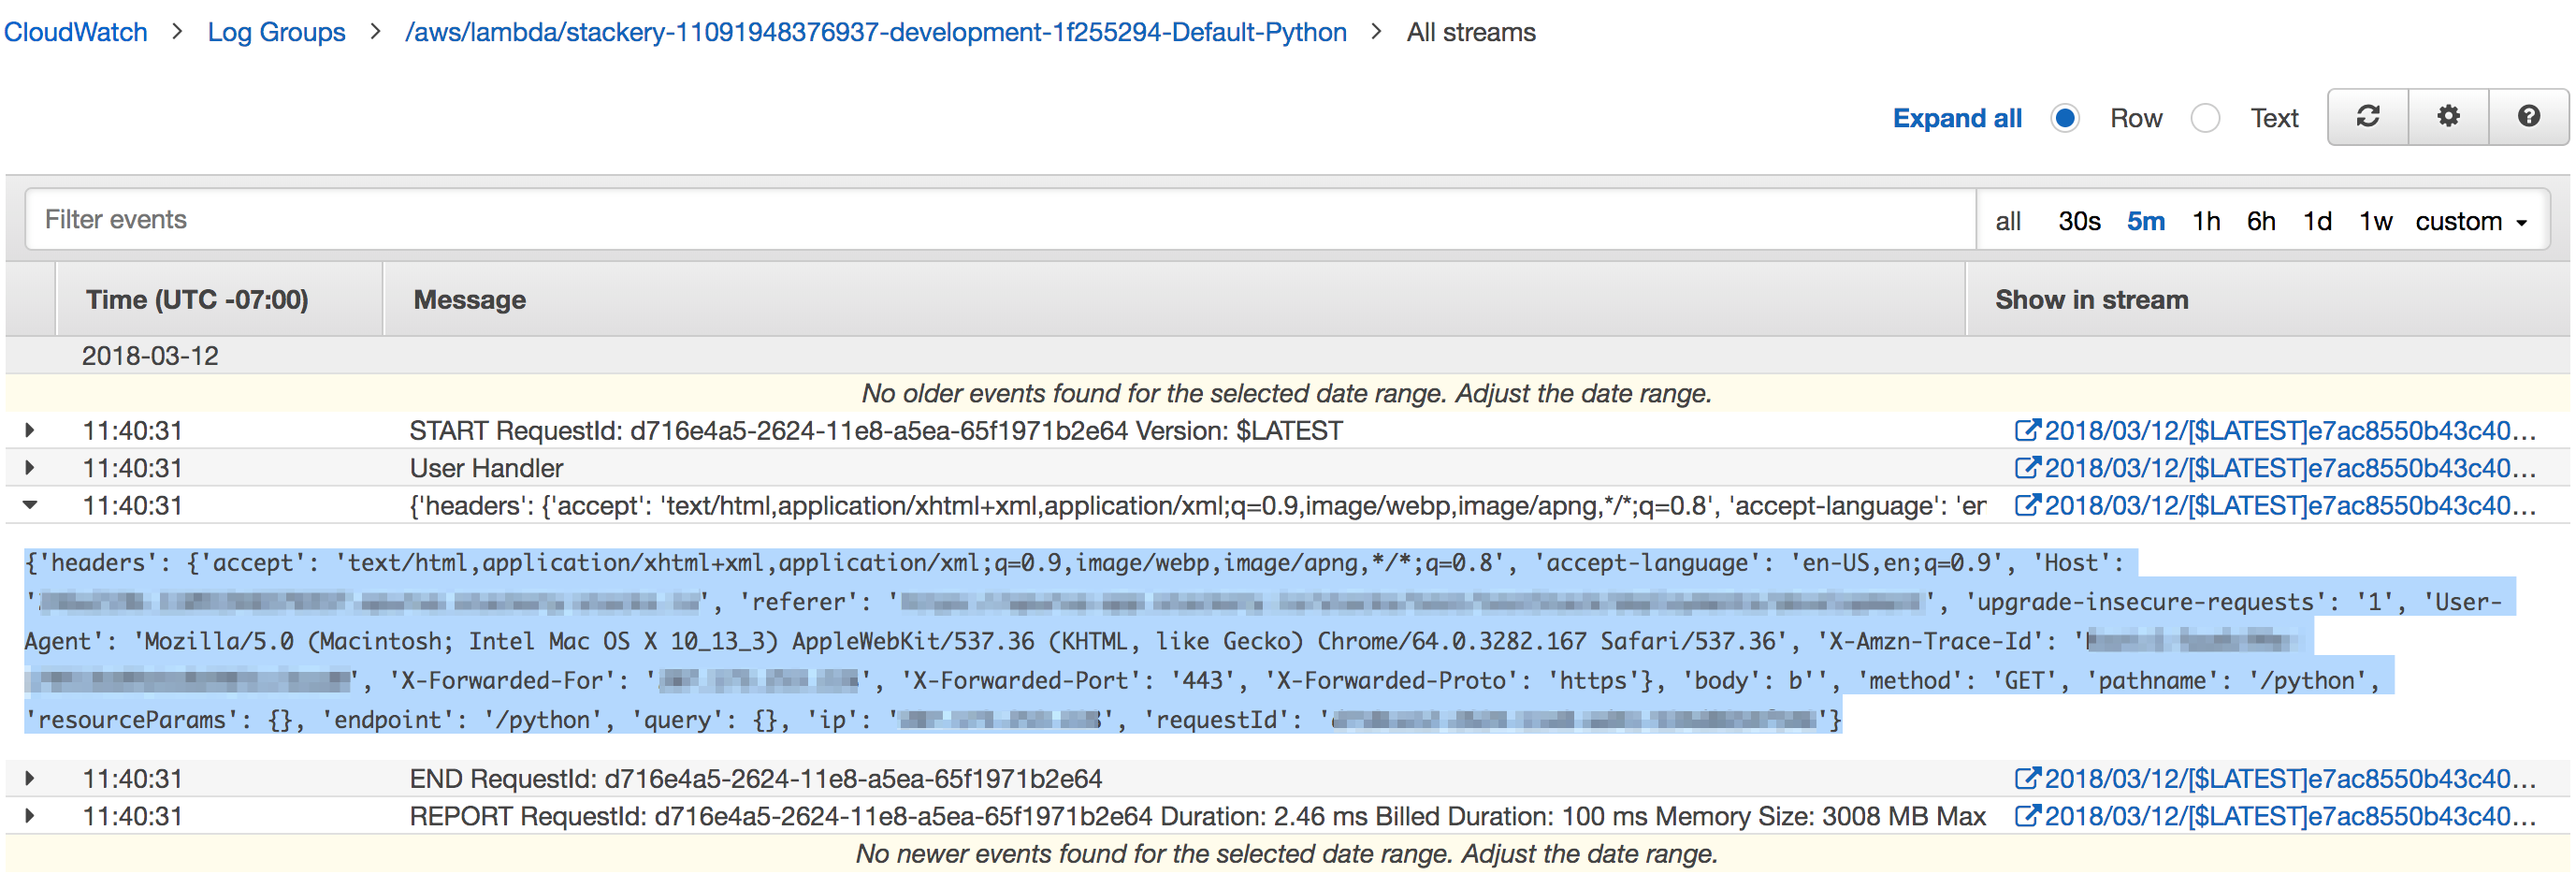
First, open your cloud watch logs for this lambda function (If you are using Stackery to manage your stack, you can find a direct link to your logs in the deployment panel) and capture the message that the function printed
Then, we can create a simple wrapper file tester.py and import the handler inside. For expediency, I also just dump the event into a variable in this file.
import my_lambda

message = {
  'headers': {
    'accept': '...',
    'accept-language': '...',
    # ...
  }
}


my_lambda.handler(message)
With this, you can quickly iterate on the code in your handler with the message that caused your failure. Just run python tester.py.
There are a handful of caveat's to keep in mind with this implementation:
- ENV vars: If your function requires any ENV vars to be set, you'll want to add those to the testing harness.
- AWS SDK: If your lambda function invokes any AWS SDK's, they will run with the credentials defined for the default user in
~/.aws/credentialswhich may cause permission issues - Dependencies: You'll need to install any dependencies your function requires
But, with those caveats in mind, I find this usually is good enough and is the fastest way to replicate an error/iterate on lambda development.
Method 2: Using Docker
For the times you need to run in a sandboxed environment that is identical (or as close to as possible) as Lambda, I turn to using Docker with the images provided by LambCI.
When debugging/iterating, I find that my cycle time is sped up by using the build images versions of the LambCI images and running bash interactively. Eg, if my function is running on Python 2.7, I'll use the lambci/lambda:build-python2.7 image. I prefer launching into bash rather than having Docker run my lambda function directly, because otherwise, any dependencies will need to be downloaded & installed each run, which can add significant latency to the run.
So in the above example, my command would be docker run -v /path/to/code:/test -it lambci/lambda:build-python2.7 bash. Then, once bash is loaded in the Docker Container, I first do the following:
- CD to the test directory:
cd /test - Install your dependencies
- Run test tester:
python /test/tester.py
With this, since we are running docker run with the -v flag to mount the handler directory inside the container as a volume, any changes you make to your code will immediately affect your next run, enabling the same iteration speed as Method 1 above. You can also attach a debugger of your choice if needed.
While this method requires some setup of Docker and thus is a little more cumbersome to start up than Method 1, it will enable you to run locally in an environment identical to Lambda.
Related posts