Observability is Not Just Logging or Metrics


Lessons from Real-World Operations
We generally expect that every new technology will have, along with massive new advantages, also has fundamental flaws that will mean the old technology always has its place in our tool belt. Such a narrative is comforting! It means none of the time we spent learning older tools was wasted, since the new hotness will never truly replace what came before. The term 'observability' has a lot of cache when planning serverless applications. Some variation of this truism is 'serverless is a great product that has real problems with observability.'
The reality is not one of equal offerings with individual strengths and weaknesses. Serverless is superior to previous managed hosting tools, and it is the lack of hassle associated with logging, metrics, measurement, and analytics. Observability stands out as one of the few problems that serverless doesn't solve on its own.
What Exactly is Observability?
Everything from logging to alerts gets labelled as observability, but the shortest definition is: observability lets you see externally how a system is working internally.
Observability should let you see what's going wrong with your code without deploying new code. Does logging qualify as observability? Possibly! If a lambda logs each request its receiving, and the error is being caused by malformed URL's being passed to that lambda, logging would certainly resolve the issue! But when the question is 'how are URLs getting malformed?' It's doubtful that logging will provide a clear answer.
In general, it would be difficult to say that aggregated metrics increase observability. If we know that all account updates sent after 9pm take over 200ms, it is hard to imagine how that will tell us what's wrong with the code.
Preparing for the Past
A very common solution to an outage or other emergency is to deploy a dashboard of metrics to detect the problem in future. This is an odd thing to do. Unless you can explain why you're unable to fix this problem, there's no reason to add detection for this specific error. Further, dashboards often exist to detect the same symptoms e.g. memory running out on a certain subset of servers. But running out of memory could be caused by many things, and provided we're not looking at exactly the same problem saying 'the server ran out of memory' is a pretty worthless clue to start worthless clue to start with.
Trends Over Incidents
Real crises are those that affect your users. And problems that have a real effect on users are neither single interactions nor are they aggregated information. Think about some statements and whether they constitute an acute crisis:
- Average load times are up 5% for all users. This kind of issue is a critical datum for project planning and management, but 'make the site go faster for everyone' is, or should be, a goal for all development whenever you're not adding features.
- One transaction took 18 minutes. I bet you one million dollars this is either a maintenance task or delayed job.
- Thousands of Croatian accounts can't log in. Now we actually have a trend! While we might be seeing a usage pattern (possibly a brute force attack), but there's a chance that a routing or database layer is acting up in a way that affects one subset of users.
- All logins with a large number of notifications backed up are incredibly slow, more than 30 seconds. This gives us a nice tight section of code to examine. As long as our code base is functional, it shouldn't be tough to root out a cause!
How Do We Fix This?
1. The right tools
The tool that could have been created to fix this exact problem is Rookout, which lets you add logging dynamically without re-deploying. While pre-baked logging is unlikely to help you fix a new problem, Rookout lets you add logging to any line of code without a re-deploy (a wrapper grabs new rookout config at invocation). Right now I'm working on a tutorial where we hunt down Python bugs using Rookout, and it's a great tool for hunting down errors.
Two services offer event-based logging that moves away from a study of averages and metrics and toward trends.
- Honeycomb.io isn't targeted at serverless directly, but offers great sampling tools. Sampling offers performance advantages over logging event details every time.
- IOpipe is targeted at serverless and is incredibly easy to get deployed on your lambdas. The information gathered favors transactions over invocations.
2. Tag, cross-reference, and group
Overall averages are dangerous, they lead us into broad-reaching diagnoses that don't point to specific problems. Generalized optimization looks a lot like 'pre-optimization,' where you're rewriting code without knowing what problems you're trying to fix or how. The best way to ensure that you're spotting trends is to add as many tags as are practical to what you're measuring. You'll also need a way to gather this back together, and try to find indicators of root causes. Good initial tag categories:
- Geography
- Account Status
- Connection Type
- Platform
- Request Pattern
Note that a lot of analytics tools will measure things like user agent, but you have to be careful to make sure that you don't gather information that's too specific. You need to be able to make statements like 'all Android users are seeing errors' and not get bogged down in specific build numbers.
3. Real-word transactions are better than any other information
A lot of the cross-reference information mentioned above isn't meaningful if data is only gathered from one layer. A list of the slowest functions or highest-latency DB requests indicates a possible problem, but only slow or error-prone user transactions indicate problems that a user somewhere will actually care about.
Indicators like testing, method instrumentation, or server health present very tiny fragments of a larger picture. It's critical to do your best to measure total transaction time, with the as many tags and groupings as possible.
4. Annotate your timeline
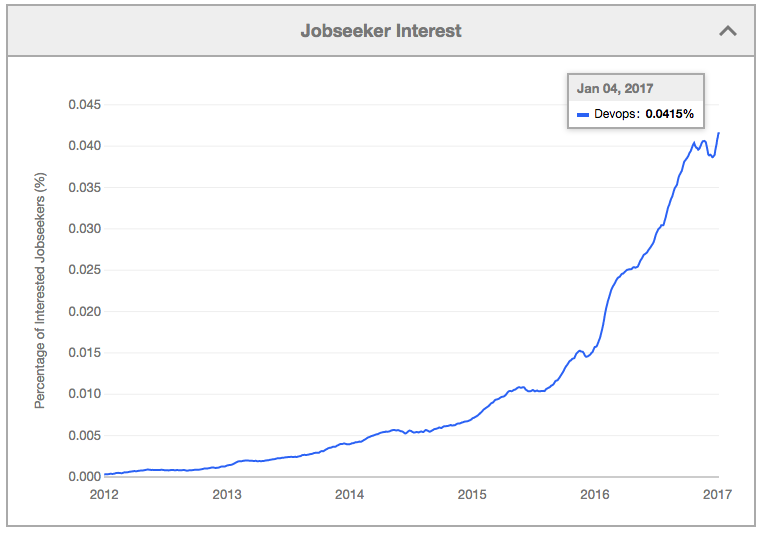
This final tip is has become a standard part of the devops playbook but it bears repeating: once you're measuring changes in transaction health, be ready to look back about what has changed in your codebase with enough time accurately to correlate it with performance hits.
This approach can seem crude: weren't we supposed to be targeting problems with APM-like tools that give us high detail? Sure, but fundamentally the fastest way to find newly introduced problems is to see them shortly after deployment.
Wrapping Up: Won't This Cost a Lot?
As you expand your logging and event measurement, you should identify that the logging and metrics become less and less useful. Dashboards that were going weeks without being looked at will go months, and the initial 'overhead' of more event-and-transaction-focused measurement will pay off ten-fold in shorter and less frequent outages where no one knows what's going on.
Related posts