Tracing Serverless Applications with AWS X-Ray

 Debugging serverless applications can be very hard. Often, the traditional tools and methodologies that are commonly used in monolithic applications don't work (easily, at least). While each service is smaller and easier to fully understand and test, a lot of the complexity and issues are now found in the interconnections between the micro-services. The event-driven architecture inherent in serverless further increases the complexity of tracing data through the application, increasing the debugging complexity.
Much of the DevOps tooling in this area is still in its infancy, but Amazon took a large step forward with AWS X-Ray. X-Ray helps tie together the various pieces of your serverless application in a way that makes it possible to understand the relationships between the different services and trace the flow of data and failures. One of the key features is X-Ray's service map, a visual representation of the AWS services in your application and the data flow between them; this ability to visually see your architecture is something we've always valued at Stackery and is a key reason we let you design your application architecture visually.
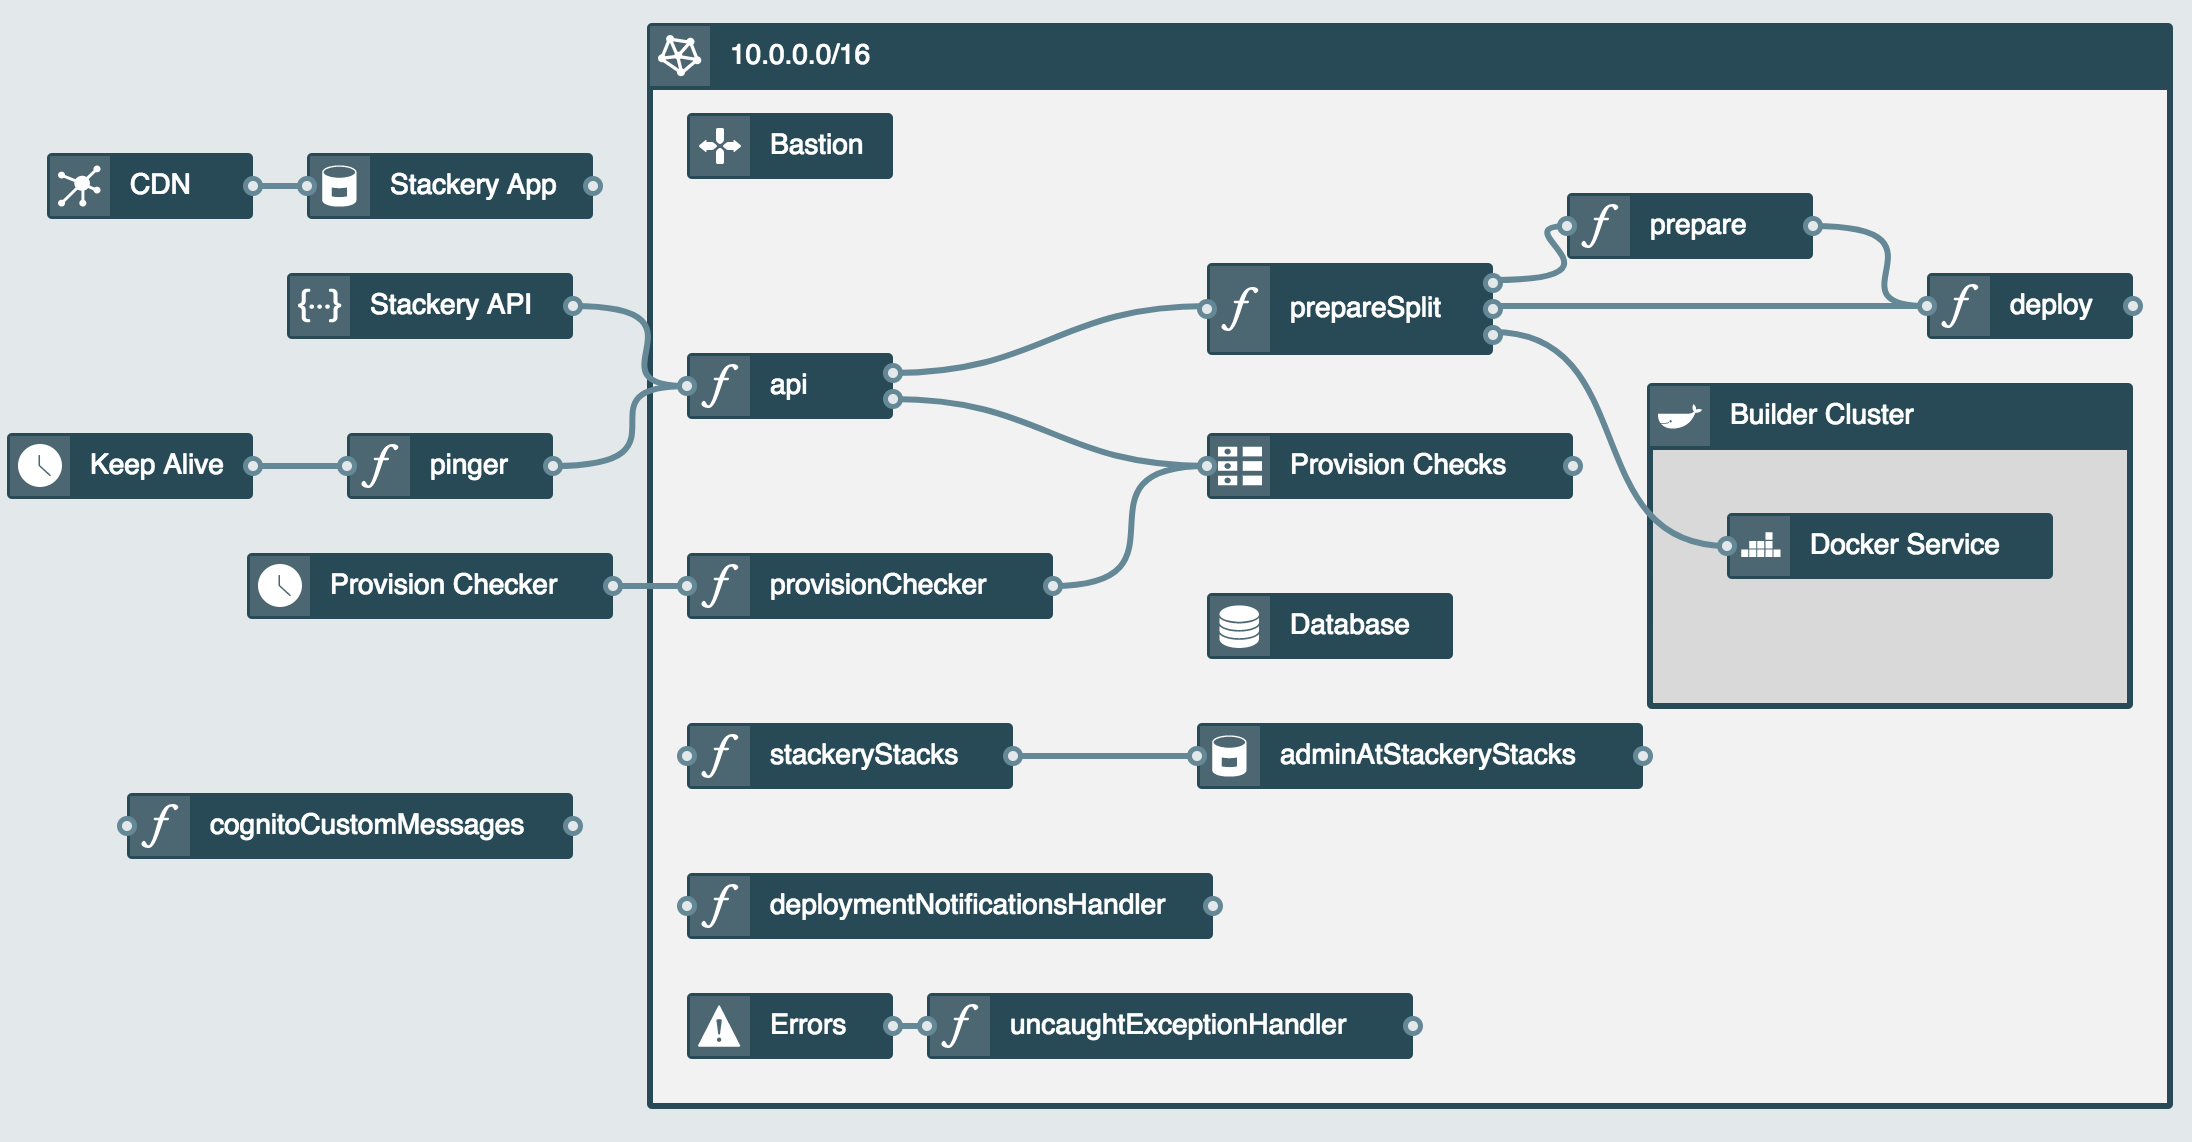
As a quick side note, it is interesting to see how a Stackery visualizes a stack compared to the AWS X-Ray visualization:
Stackery Representation
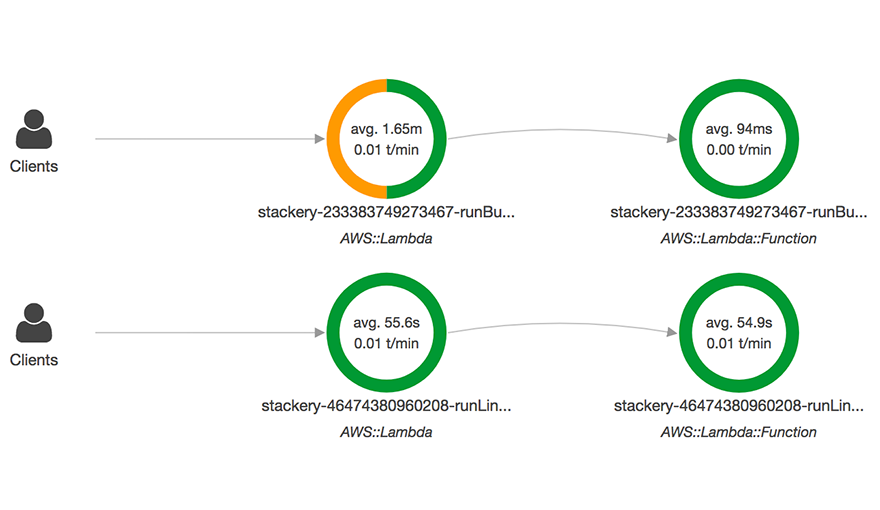
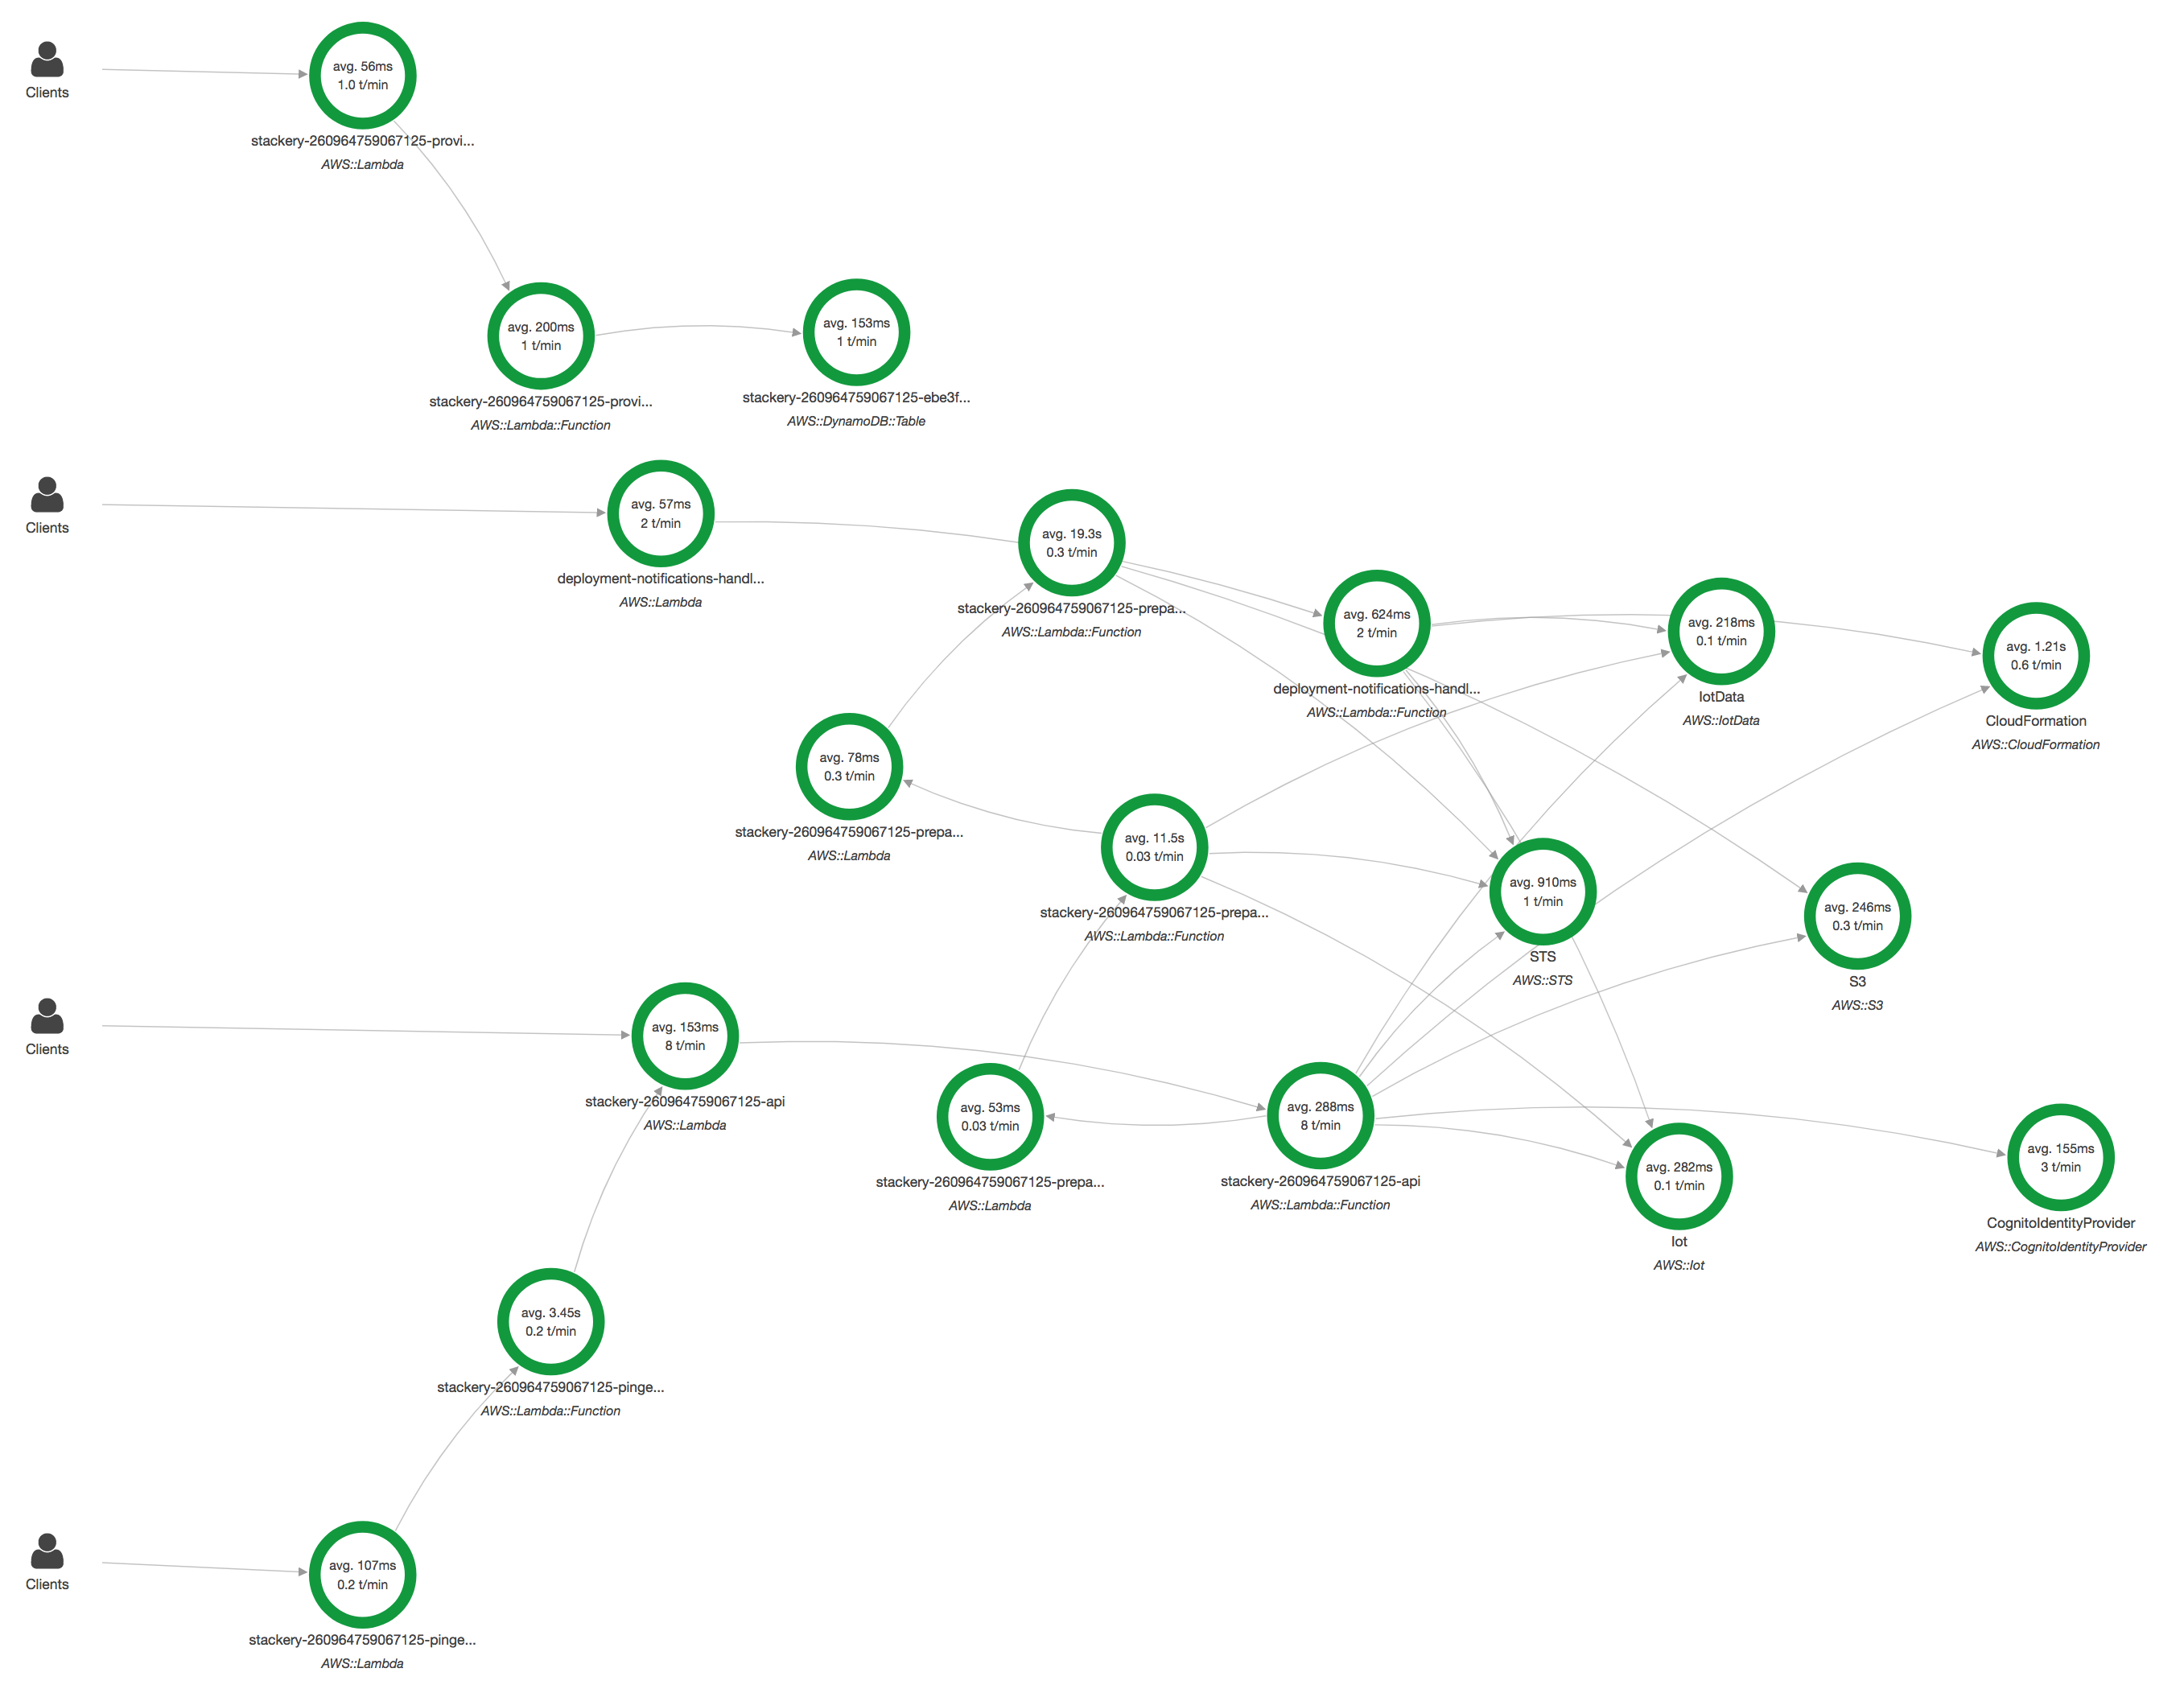
AWS X-Ray Representation
When a request hits a service that provides active X-Ray integration (and one that you've set up to use X-Ray), it will add a unique tracing header to the request which will also be added to any downstream requests that are generated. Currently, Amazon supports only AWS Lambda, API Gateway, EC2, Elastic Load Balancers and Elastic Beanstalk for active integration. Most other services support passive integration, which is to say that they'll continue adding to the trace if the request already has the tracing header set.
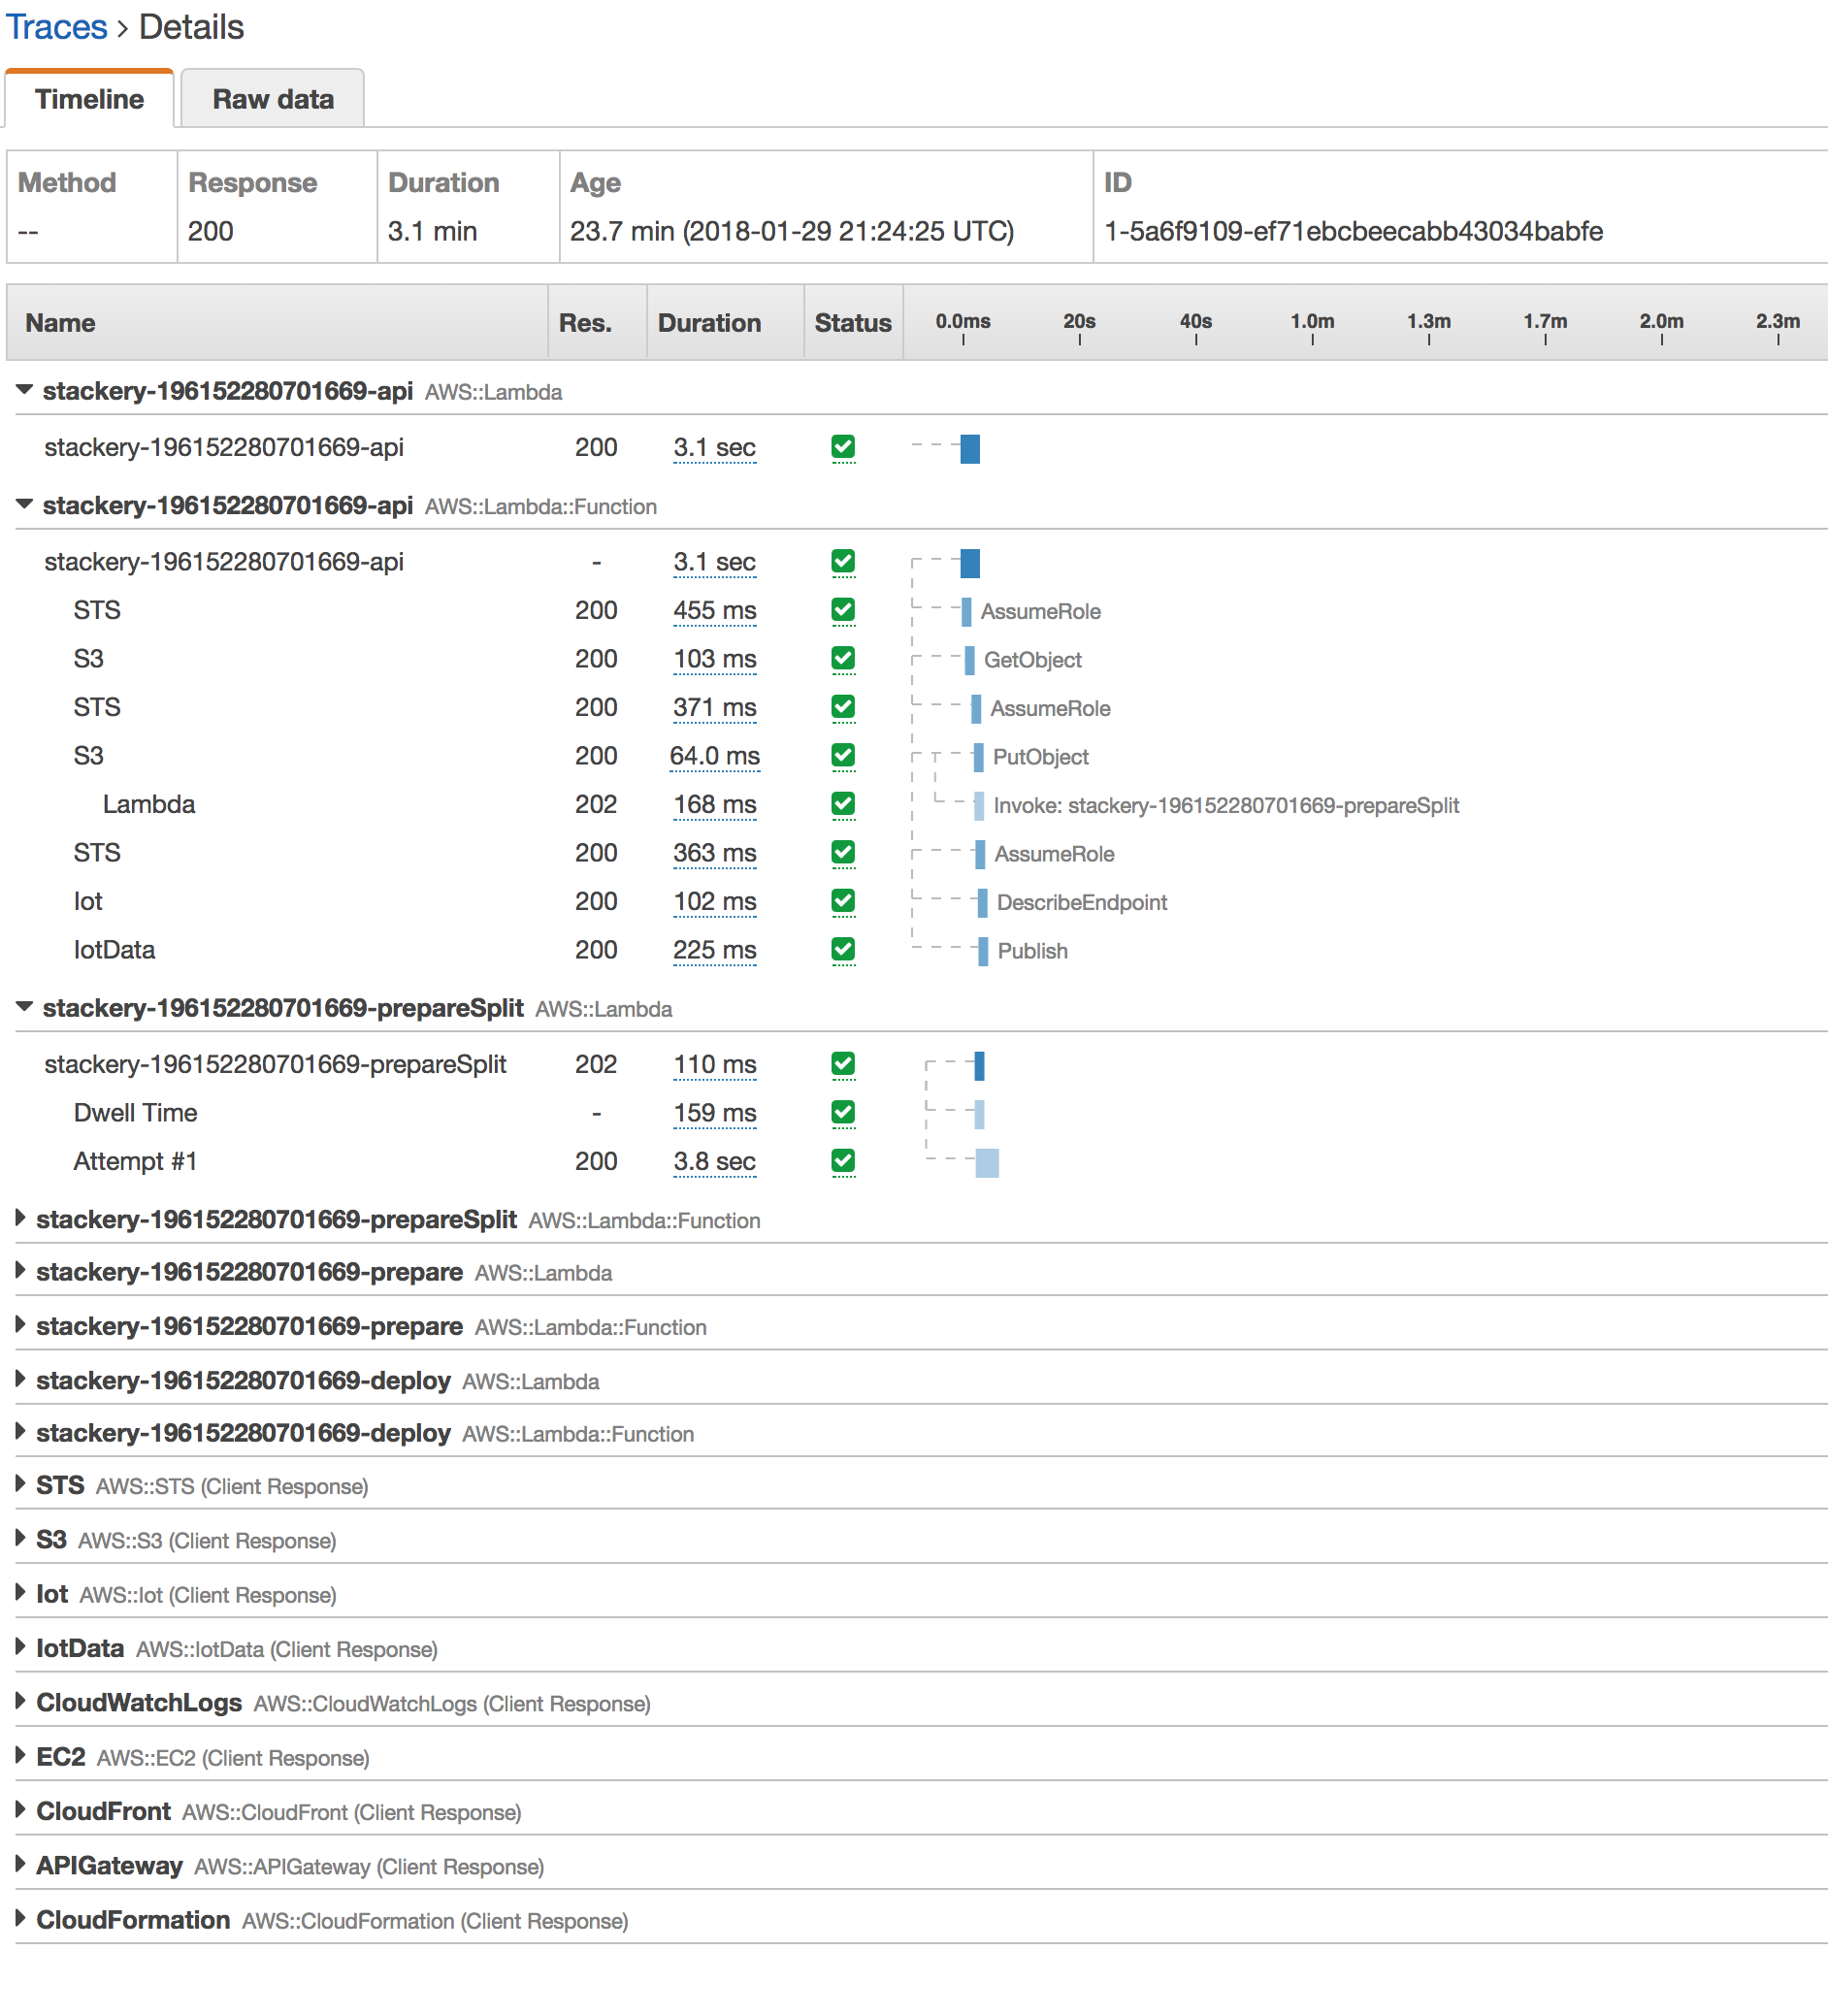
With AWS X-Ray enabled throughout your application, you can click on nodes in the Service Map to see details such as the response distribution and dive into trace data. Here are some traces for a few AWS services - CloudFormation, DynamoDB, Lambda, and STS:
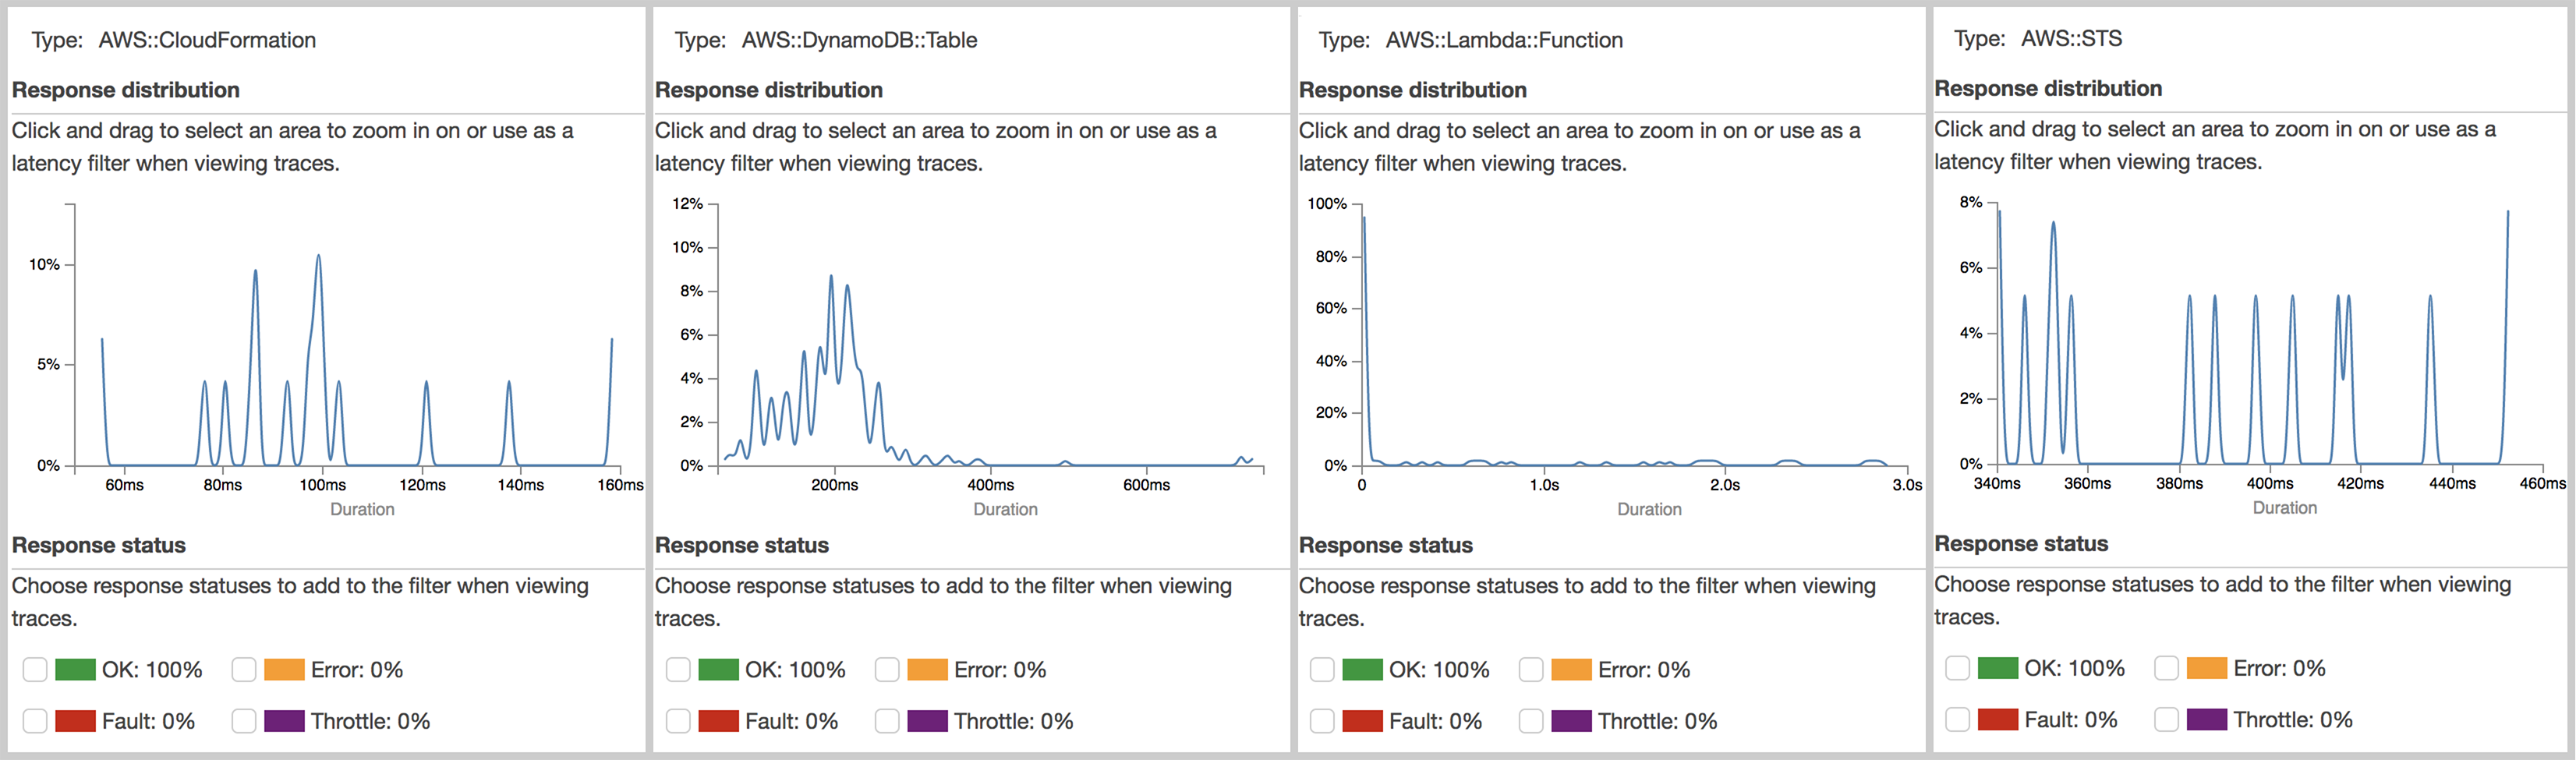
This view is useful to get a high-level view of the health and status of your services. Diving in further will allow you to view specific traces, which is critical for understanding which services are slowing your application down or root causing failures.
One limitation to keep in mind is that the X-Ray service map will only allow you to view data in 6 hours or smaller chunks, but it keeps a 30-day rolling history.
Enabling X-Ray can be tedious. For instance, to enable X-Ray on AWS Lambda, you need to do three things for each lambda function:
- Enable active tracing
- Update your code to use the AWS X-Ray enabled SDK rather than the standard AWS SDK
- Node.js - Java - Go - Python - .Net - Ruby
- Using the AWS X-Ray enabled SDK lets Lambda decide on how often and when to sample/upload requests
- Add the needed IAM permissions to upload the trace segments
Unfortunately, needing to do this for every lambda function, old and new, makes it ripe for human error.
Details on how to enable active tracing on other services can be found here.
At Stackery, we think enabling data tracing is another critical component in Serverless Ops, just like handle Errors and Lambda timeouts. So any stack deployed with Stackery has AWS X-Ray automatically enabled - we make sure that any AWS service used has the correct settings to enable active AWS X-Ray tracing if supported and for lambda functions, we take care of all of the steps so you don't need to worry about permissions or updating your code to use the right SDK.
Related posts